Business Intelligence (or BI) development is fast becoming one of the most popular courses we offer. But what is Business Intelligence? We explain it here…
Let’s start with a nice cup of tea
First off, imagine that you went to your favourite store to buy some herbal tea. When you pay for your tea and walk out, you may or may not know that your favourite store has gathered some new data about the herbal tea you bought, at what time you bought it, and how much you paid.
Now I want you to put yourself in the shoes of the herbal tea shop owner. Day in and day out he has to figure out how many bags of tea leaves he should be ordering. The only possible way for him to make an educated guess about this, is if he knows how many are being purchased by his customers.
Now, as the data sits today, the owner of the store would have to look at every single transaction made throughout each day to see how much tea was purchased. But this takes up way too much time, and since this is a decision the owner has to make every week, he decides to use a Business Intelligence tool to provide that information.
The use of a Business Intelligence tool allows for information to be regularly rolled up and formatted just right so the owner can make a much more educated decision about how much herbal tea to purchase. Additionally, now that the Director has more time on his hand, he can analyze in much further detail.
Making life easier for everyone
So basically you can think of Business Intelligence as the process of going from raw data to legible information. Now consider how broad the Business Intelligence space is. For example, have you ever received a receipt from an ATM machine that provides you a current balance in your bank account? Or perhaps have you ever received a detailed bill in the mail? These are all forms of Business Intelligence (or BI).
Common forms of BI
Operational Reporting
This form of reporting is akin to the detailed bill in the mail or your ATM receipt. It provides a very structured template of how the data is to be delivered to the end user. The end users experience needs to be considered in a lot more detail as the path of analysis and how the person will consume the data are typically nested in the report templates.
Ad Hoc reporting
This type of reporting is intended to empower a business person to play the report authoring role. By doing this, the look, feel, and content of the report can be controlled by its consumer. Most Ad Hoc tools have built-in assumptions regarding design and navigation, to keep the business person from getting overwhelmed with complexity. The queries and their structures are maintained by IT and are developed jointly with business user inputs.
OLAP Analysis
This type of analysis delivers pre-calculated and pre-structured data sets for business people to explore. Many tools that connect to OLAP feel more like data navigation tools than pure report authoring tools.
Data Visualization
In Data Visualization the roll up of data is commonly conducted algorithmically and stored in memory. This makes the experience of BI far more plug & play in nature. And, it also allows the business to answer one-off questions in a much simpler way. Because the roll up of the data commonly occurs automatically, it also tends to be very processor and query intensive.
Dashboards
Dashboards typically represent a high-level view of an organization. This keeps the executive from having to thumb through hundreds of reports and data elements. If a troubled area arises in the dashboard, the executive can drill into the alert to see a more detailed report. Often dashboards are simply compositions of the various data delivery methods we just discussed.
Each of the delivery methods described above typically come as part of a suite or platform for managing the various forms of content. This means everything from scheduling automated report delivery to keeping the data secure are all conducted in a single platform.
Of course there are other forms of Business Intelligence, this article isn’t meant to cover every way you could consume data. But hopefully you can get a sense of some common ways businesses are turning raw data into comprehensible information, and why we need more and more BI Developers in the world.
Contact us today if you would like to know more about BI Development, or sign up for our next intake.
What is Industry Connect?
Industry Connect is an IT/Software Career Launchpad that has everything you need
to kick-start your IT/software career in AU, NZ, UK, IE, SG, HK, IN, ID, VN & PH.
We have been helping career changers, recent IT graduates and people with a career gap
to start their IT/software careers.
Over the years, we have helped hundreds kick-start an IT/software career.
(Verifiable evidences are available on this website)
OUR CORE
We are an innovative software training school backed by global/local software companies.
Our ecosystem is an incubation process that supports our participants until they launch
a tech career.
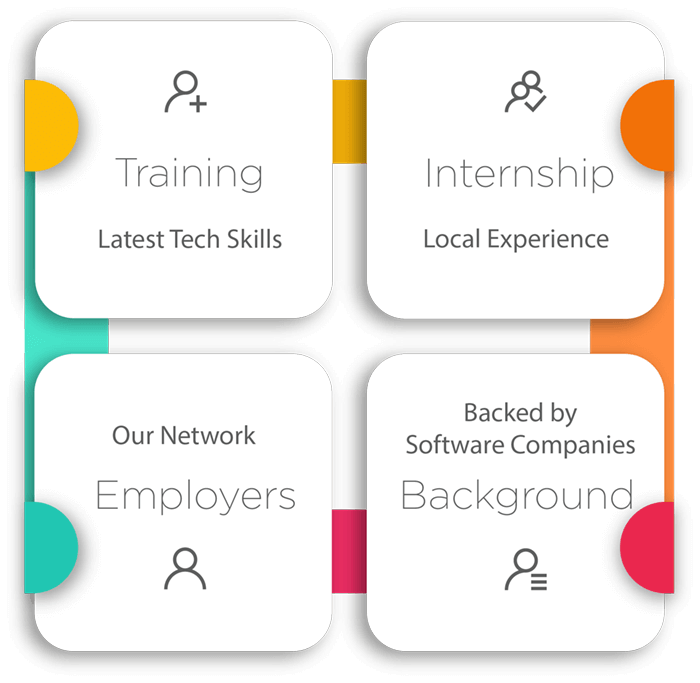
OUR PROGRAMMES
Our Job-Ready training programmes focus on:
- Software Development
- Business Intelligence (or Data Analyst)
- Test Analyst
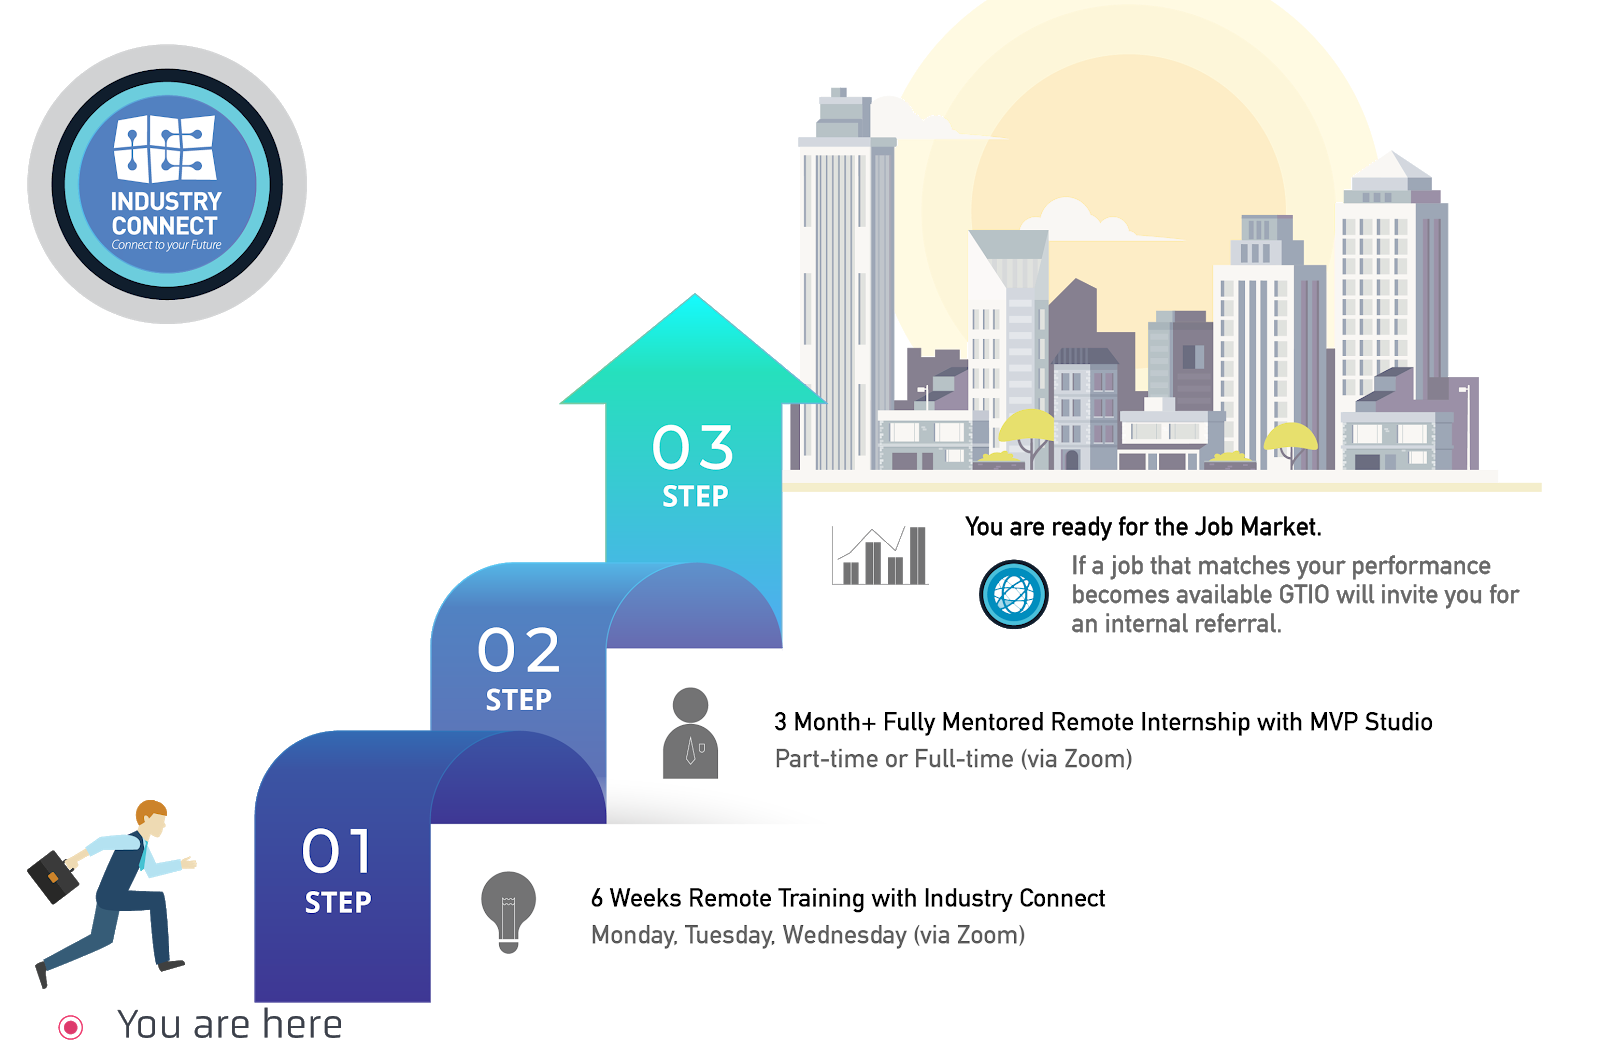
PROGRAMME STRUCTURE
- Six Weeks Training Classes (Practical Tech Skills)
- Three Months (or more) Structured Internship on Large Commercial-Scale Projects (flexible hours)
- Employer Network (job analysis and internal referral if goals are met)
You can join us via Zoom (live face-to-face meeting) remotely from anywhere and
“download” the valuable knowledge & experiences from our tech experts across
different tech centres.
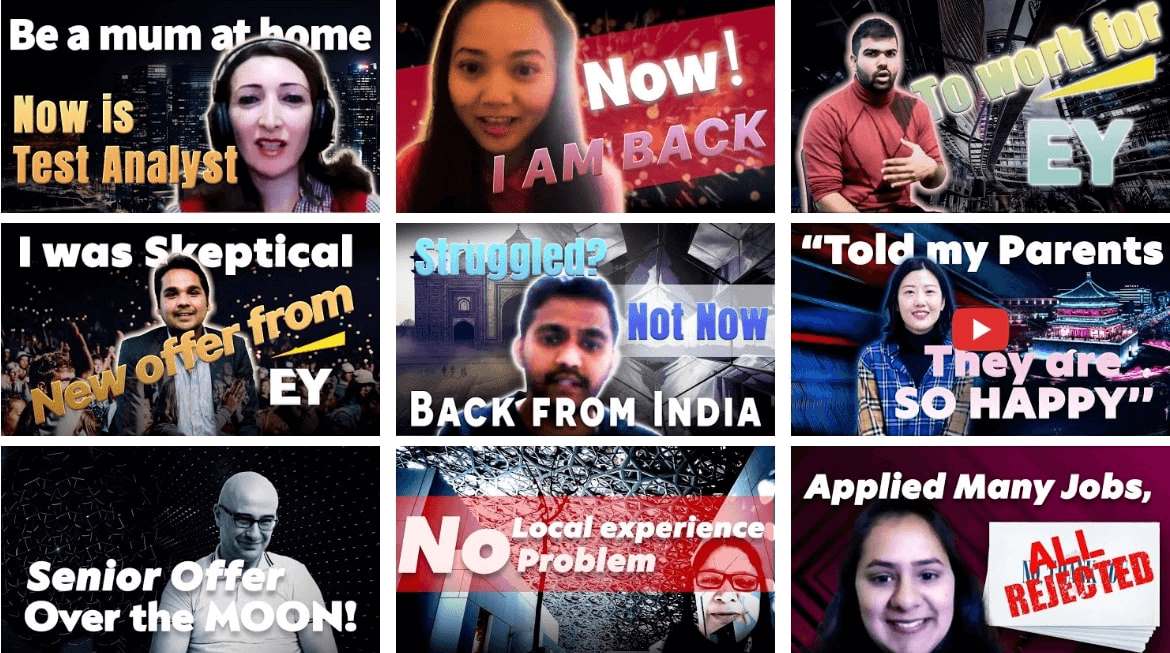
Watch 300+ Stories of Career Starters in IT/Software
- Career Changers & Switch to IT
- Recent Graduates
- People with a Career Gap
- New Software Developers
- New BI or Data Analysts
- New Test Analysts
Click the image to watch those who changed their careers to IT, had gap years and recent IT graduates.


Recent Posts
AU, NZ, SG, UK, IE, CA